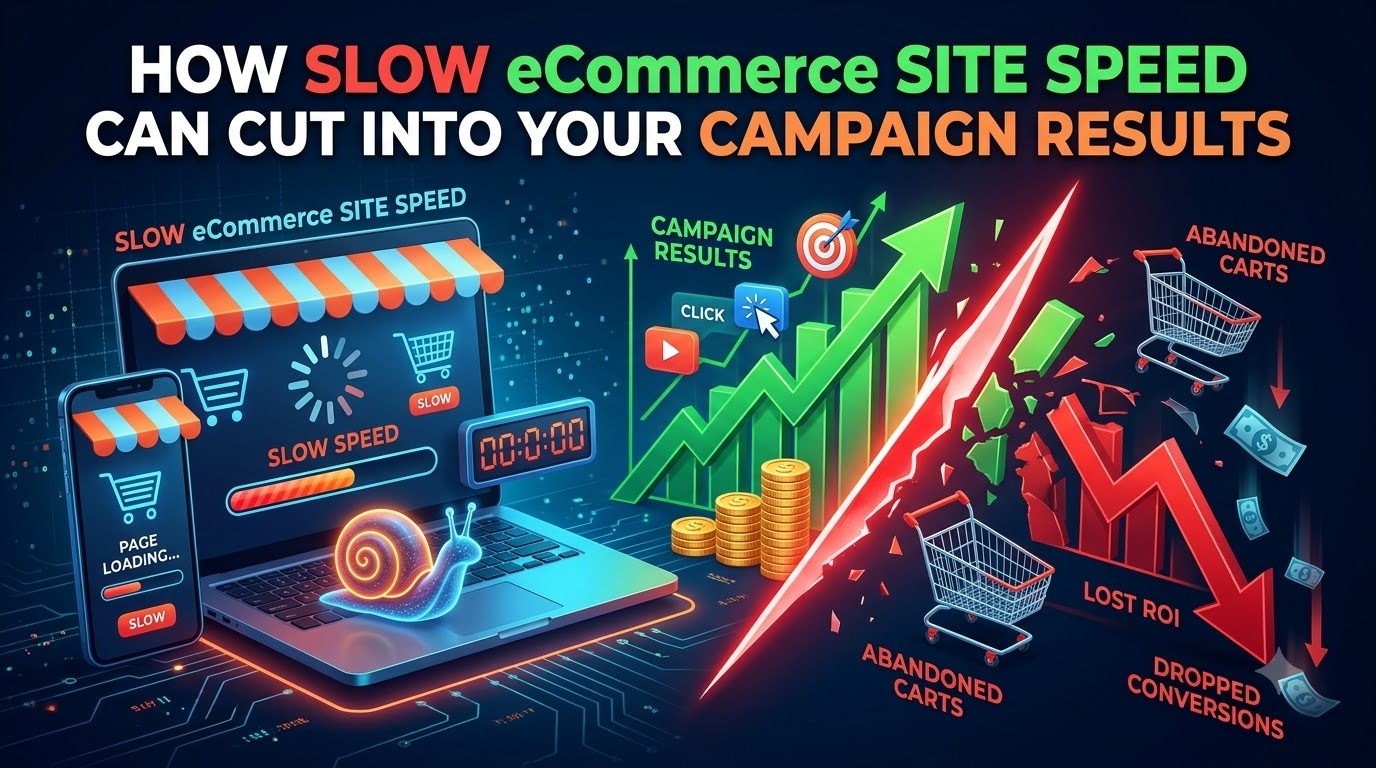
How Slow eCommerce Site Speed Can Cut Into Your Campaign Results
You spent weeks perfecting your campaign strategy. You designed eye-catching ad creatives, drafted high-converting copy, built hyper-targeted audiences, and allocated thousands of dollars to Meta, Google, and TikTok ads.
On day one, the click-through rates (CTR) look fantastic. Traffic is surging.
Then you check your attribution dashboard: Conversions are practically zero, and your Return on Ad Spend (ROAS) is in the red.
Where is the breakdown? You audit the ad platform, check the audience targeting, and test the checkout flow yourself on ultra-fast office Wi-Fi. Everything seems fine.
The invisible culprit isn’t your offer, your ad creative, or your targeting. It’s latency.
Slow site speed acts as an invisible tax on your marketing budget. It quietly inflates your Cost Per Acquisition (CPA), tanks your conversion rates, and reduces your ad platform algorithms’ ability to find buyers.
Here is an in-depth breakdown of how slow eCommerce loading times erode campaign performance—and how you can fix it.
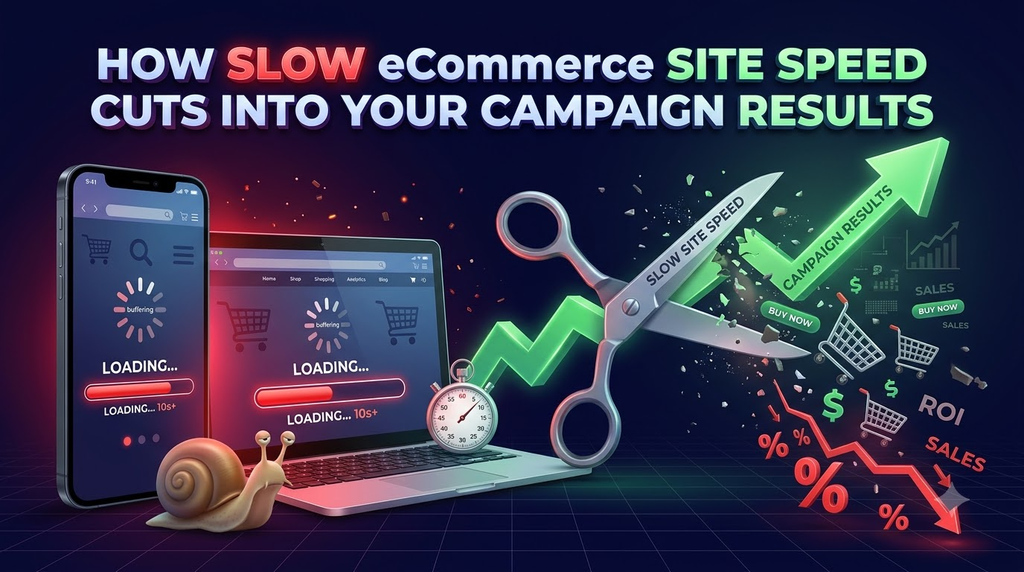
1. The “Click-to-Page-View” Leak: Losing Money Before the Page Loads
When a user clicks your paid ad, two distinct metrics are tracked:
- Outbound Clicks (measured by the ad platform).
- Landing Page Views (measured when your site’s tracking pixel actually fires).
On a fast-loading website (under 1.5 seconds), these two numbers stay close. But on a slow site, a massive discrepancy emerges called click drop-off.
textAd Click (User waits...) ──> 1 sec ──> 2 sec ──> [USER ABANDONS] ──> Page Never Loads
                                                                        └─> Pixel Never Fires
Mobile users are impatient. Research shows that as page load time goes from 1 second to 3 seconds, the probability of a bounce increases by 32%. By 5 seconds, it increases by 90%.
The Paid Ad Impact:
If you pay $2.00 per click and 30% of users bounce before your tracking script even initializes, your effective Cost Per Landing Page View isn’t $2.00—it’s $2.85. You are literally burning nearly a third of your ad budget on users who never saw your product.
2. The Ad Platform Penalty: How Speed Inflates Your CPC
Modern ad platforms (Google Ads, Meta Ads, TikTok) want to protect their user experience. They do not want users clicking an ad only to sit staring at a blank screen.
To prevent this, algorithms penalize slow-loading landing pages:
- Google Ads Quality Score: Google explicitly uses landing page experience as a key component of Quality Score. A slow page leads to a low Quality Score, which directly increases your Cost Per Click (CPC) and lowers your Ad Rank in search auctions.
- Meta (Facebook) User Experience Signals: Meta measures load time metrics post-click. Pages with high bounce rates and long load times receive lower relevancy scores, causing Meta’s auction system to charge you higher CPMs (Cost Per Thousand Impressions) to deliver your ads.
Key Takeaway: Slow site speed doesn’t just lower your conversion rate; it makes every impression and click significantly more expensive to buy in the ad auction.
3. The Math of Lost Revenue: A Real-World Scenario
To visualize the impact, let’s look at how a simple 1-second delay alters the financials of a hypothetical $20,000 ad campaign.
Scenario A: Fast Site (1.5-second load)
- Ad Spend: $20,000
- Avg. CPC: $2.00 (10,000 clicks)
- Landing Page View Rate: 90% (9,000 visitors arrive)
- Conversion Rate (CVR): 3.0%
- Total Purchases: 270
- Average Order Value (AOV): $80
- Total Revenue: $21,600
- ROAS: 1.08x
Scenario B: Slow Site (3.5-second load)
- Ad Spend: $20,000
- Avg. CPC: $2.30 (Penalized by ad networks) = 8,695 clicks
- Landing Page View Rate: 70% (Higher drop-off rate) = 6,086 visitors arrive
- Conversion Rate (CVR): 2.1% (Tanks due to poor UX and high INP)
- Total Purchases: 127
- Average Order Value (AOV): $80
- Total Revenue: $10,160
- ROAS: 0.50x
By letting page load times slip by just 2 seconds, revenue was cut in half, turning a profitable campaign into a massive loss.
4. Why Marketers Accidentally Make Their Own Sites Slow
Ironicaly, the efforts meant to measure and optimize marketing campaigns are often the primary cause of site slowdowns.
textIncoming Mobile Traffic
       │
       ├──> Meta Pixel Script (50kb)
       ├──> Google Tag Manager (120kb)
       ├──> TikTok Pixel (45kb)
       ├──> Hotjar Session Recorder (200kb)
       ├──> Klaviyo Popup Script (180kb)
       └──> Live Chat Widget (350kb)
       │
       └──> RESULT: Main Thread Blocked for 2.4 Seconds ──> High INP / Slow LCP
Common marketing culprits that degrade site performance include:
- Tag Bloat: Stacking dozens of client-side tracking scripts inside Google Tag Manager (GTM). Every third-party script requires network DNS lookups, downloads external JavaScript, and locks up the browser’s main thread.
- Unoptimized Campaign Assets: Landing pages featuring uncompressed hero images, auto-playing unoptimized header videos, or giant GIF banners designed for desktops that crush mobile CPU processing power.
- Heavy Pop-ups & Slide-ins: Dynamic, script-heavy email capture pop-ups that fire immediately upon load, blocking the rendering of core product content (Largest Contentful Paint / LCP).
5. Modern Metrics That Matter: Core Web Vitals for Marketers
To understand performance bottlenecks, marketing and development teams must look at Core Web Vitals:
- Largest Contentful Paint (LCP): How long it takes for the main content (usually your hero product image) to render on screen.
- Target: < 2.5 seconds
- Interaction to Next Paint (INP): Measures page responsiveness. When a user clicks “Add to Cart” or opens a color selector, how quickly does the screen update?
- Target: < 200 milliseconds
- Cumulative Layout Shift (CLS): Does the content jump around while loading, causing misclicks?
- Target: < 0.1
If your site scores poorly on these metrics, users on mobile devices with spotty 4G connections will struggle to navigate, leading to abandoned carts.
6. How to Protect Your Campaign Budget: Action Plan
You don’t need to choose between analytics/conversion tools and lightning-fast speeds. Here is how to reconcile both:
Step 1: Migrate to Server-Side Tracking (Meta CAPI / SS-GTM)
Instead of forcing the user’s mobile browser to run 10 different tracking scripts simultaneously, switch to Server-Side Tracking via Google Tag Manager or Meta Conversions API (CAPI).
textBrowser (Fast & Light) ──> Web Server ──> Server-Side GTM ──> Meta / Google / TikTok APIs
Your website sends a single event payload to your cloud server, which then securely distributes the data to Meta, Google, and TikTok behind the scenes. This strips out heavy JavaScript from the client browser while improving attribution accuracy.
Step 2: Implement Aggressive Image & Media Optimization
- Use modern formats like WebP or AVIF instead of heavy PNGs or JPEGs.
- Lazy-load below-the-fold content, but never lazy-load your primary LCP hero image.
- Replace auto-playing background videos with optimized CSS or lightweight vector assets on mobile devices.
Step 3: Implement Edge Caching
Use Content Delivery Networks (CDNs) like Cloudflare or Fastly to store dynamic page HTML close to your users geographically. Serving pages from edge locations around the world slashes Time to First Byte (TTFB) to under 100ms.
Step 4: Run a “Tag Audit”
Audit your Google Tag Manager container every quarter. Delete tracking pixels for dead ad platforms, deactivate unused heatmapping tools, and defer non-critical scripts (like review widgets or support chats) until after the main product interface renders.
Conclusion: Speed Is a Marketing Channel
Marketing success relies on alignment across every touchpoint. You can craft the best ad campaign in the world, but if your landing page takes four seconds to load, you are subsidizing your competitors who prioritize site speed.
Stop treating web performance solely as an IT issue. Site speed is an essential marketing channel.
Before scaling your ad budget next quarter, run your core landing pages through Google PageSpeed Insights. Fix the performance issues first, reduce your bounce rates, and keep your hard-earned ad dollars where they belong: in your revenue column.